🐞 Debugging
RetroC64 comes with an integrated debugger implemented entirely in the RetroC64 .NET runtime by using the Debug Adapter Protocol (DAP).
You can install the RetroC64 VSCode extension. This extension provides only the necessary VSCode integration to connect to the RetroC64 debugger easily from within VSCode.
Features
- Attach to debugger: Connect to RetroC64 debugger running on port 6503 (default)
- Register access: Full read-write access to CPU registers, CPU flags, stack, and zero page addresses
- Hardware registers: Access to VIC and SID registers
- Breakpoints: Set code breakpoints and data breakpoints (watchpoints)
- Execution control: Step-in, step-over, step-out, pause, and continue
- Memory inspection: View RAM contents
- Code analysis: View disassembly
Usage
Create the following .vscode/launch.json file in your project and press F5 to start debugging:
{
  "version": "0.2.0",
  "configurations": [
    {
      "name": "RetroC64 Attach",
      "type": "RetroC64",
      "request": "attach",
      "debugServer": 6503
    }
  ]
}

Only the attach request is supported since the RetroC64 debugger is started automatically when you run your C64 program during a RetroC64 run/live session (via dotnet watch -- run).
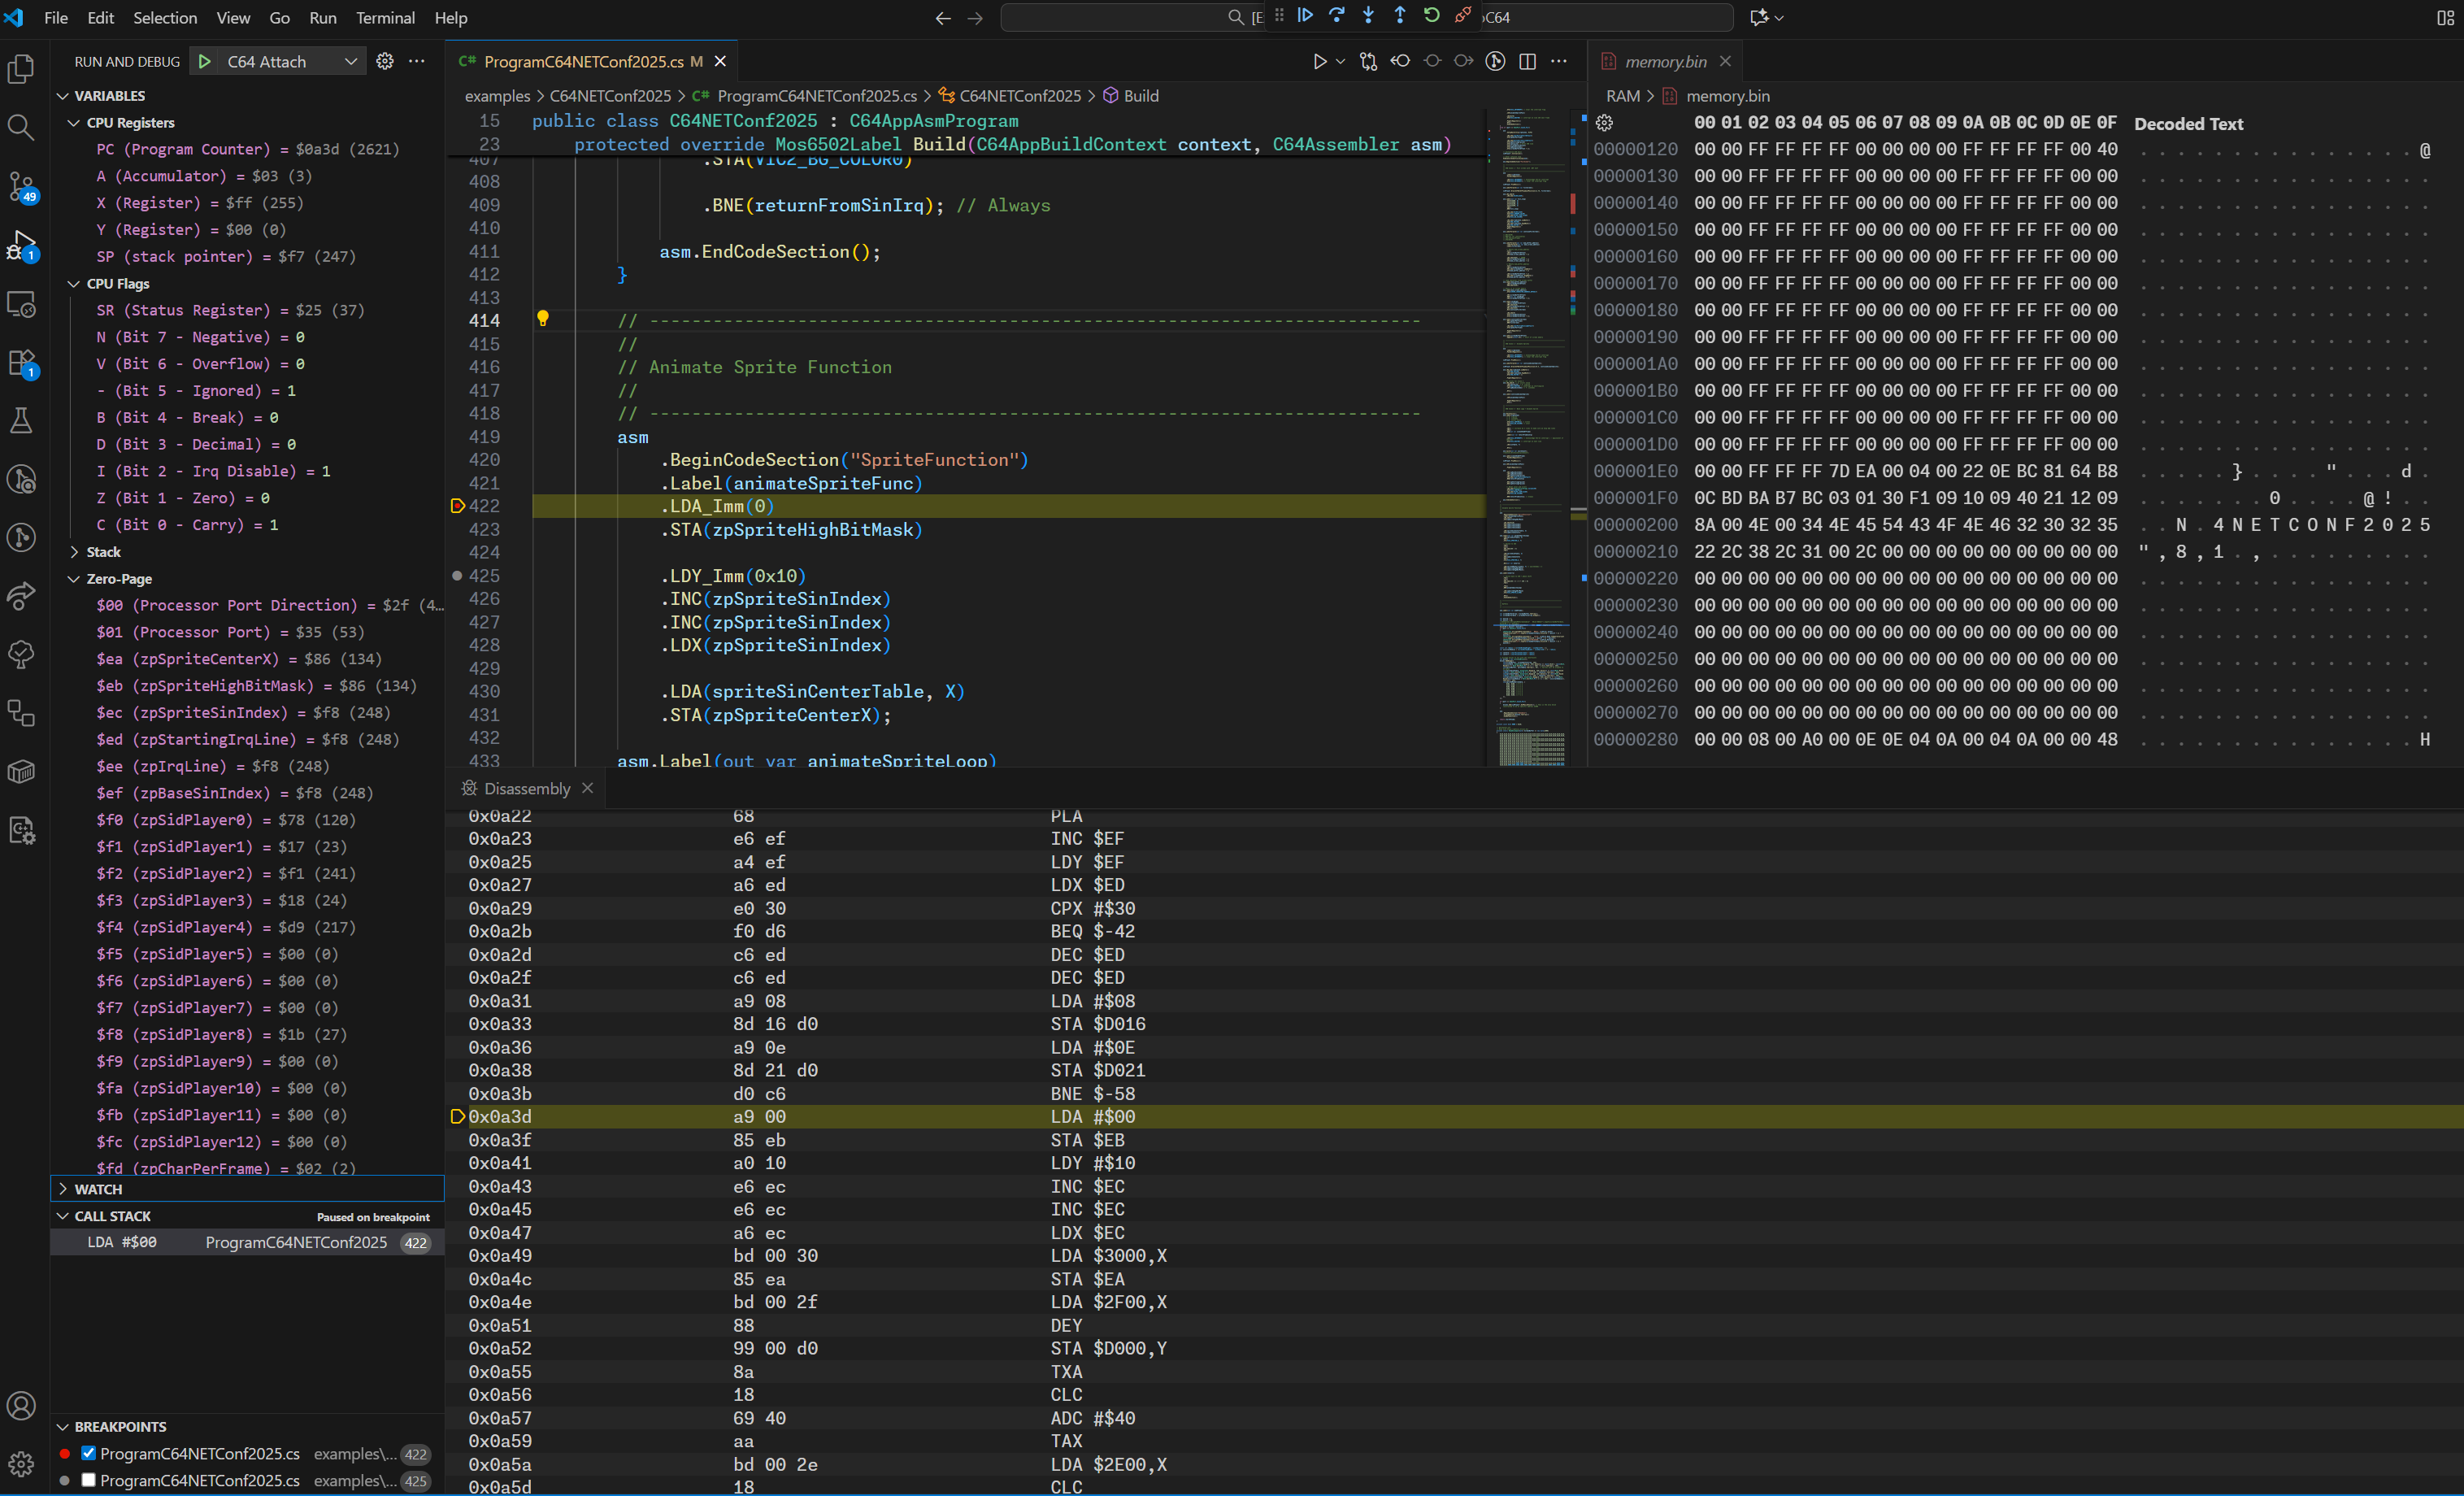
Variables
The Variables tab in VSCode shows the following variable groups:
- CPU Registers: A, X, Y, PC, SP, and CPU flags (N, V, B, D, I, Z, C)
- Stack: View the contents of the stack (from $0100 to $01FF)
- Zero Page: View the contents of the zero page (from $00 to $FF)
- The name of the variables allocated via the
C64Assembler.ZpAllocmethod are visible in the Variables pane of the debugger.
- The name of the variables allocated via the
- VIC and Sprite Registers: View the contents of the VIC-II registers (from $D000 to $D02E)
- SID Registers: View the contents of the SID registers (from $D400 to $D41C)
Breakpoints
You can set code breakpoints by clicking in the gutter of the source code editor in VSCode.
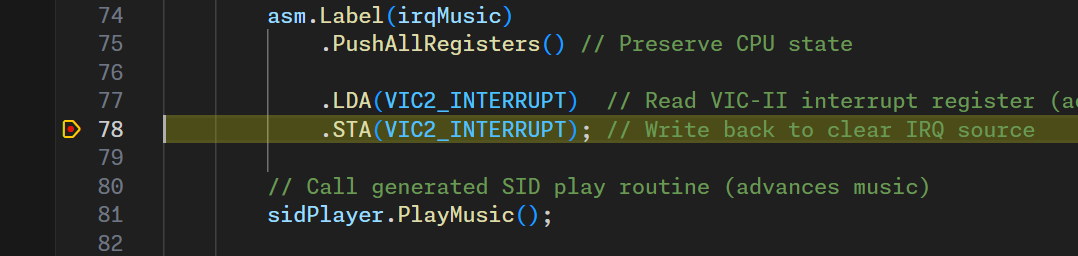
In order for the debugger to allow breakpoint on Asm6502 instructions, the Asm6502 assembler stores debug information when the C# code is compiled.
If you are using a sub function to build your assembly code, by default, only the instructions within this function will have debug information, not the method itself.
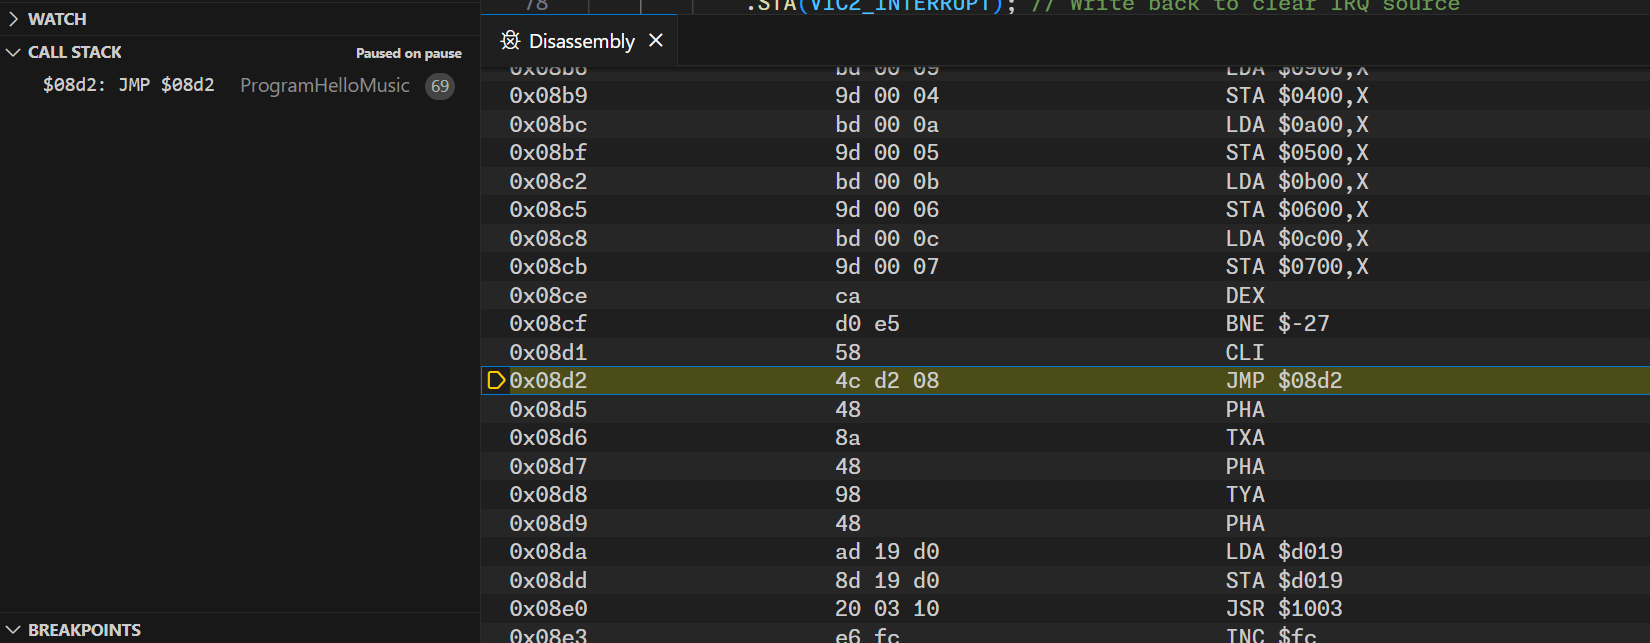
Disassembly View
By clicking on the CALL STACK frame entry, you can open the Disassembly view that shows the disassembled code around the current program counter (PC):
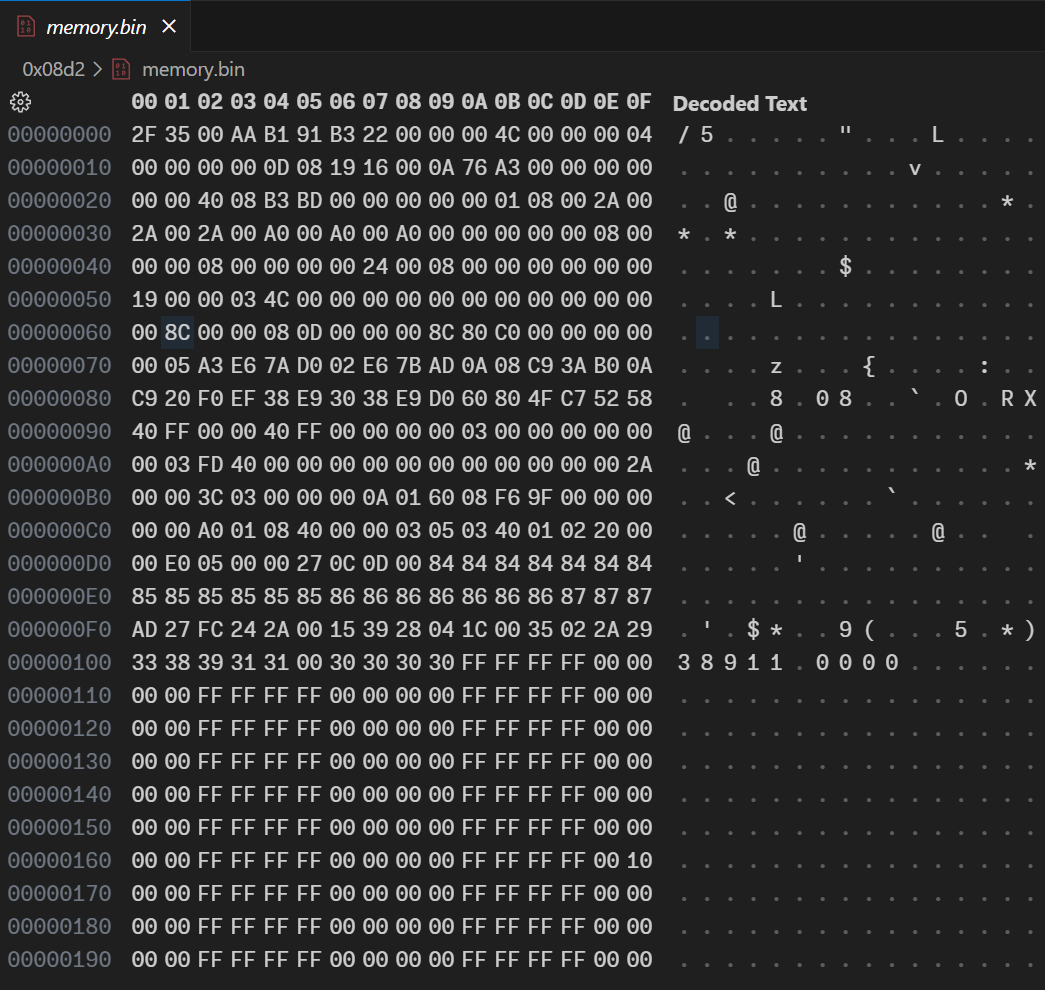
Memory View
By clicking on the PC register, you can open the Memory view that shows the entire memory of the C64 (64 KiB):